100 Chart (Hundreds Chart)
Free. No ads. No sign-up.
The 100 chart: the numbers 1 to 100 in ten rows of ten. Print it filled in, blank or with missing numbers, mark the 2s, 5s or 10s, and download a PDF on US Letter or A4. This is the counting chart, not the multiplication grid.
Class set
One copy for every student: type the first names and get one PDF, with each name on that student's own pages. Every student's pages use the same settings.
Link to this page
Free to link and share. No sign-up, no ads.
Updates as you choose. Print at 100% (actual size) so nothing is cut off.
Looking for the multiplication grid? Multiplication chart 1–100 (products up to 100 × 100)
Three ways to use it
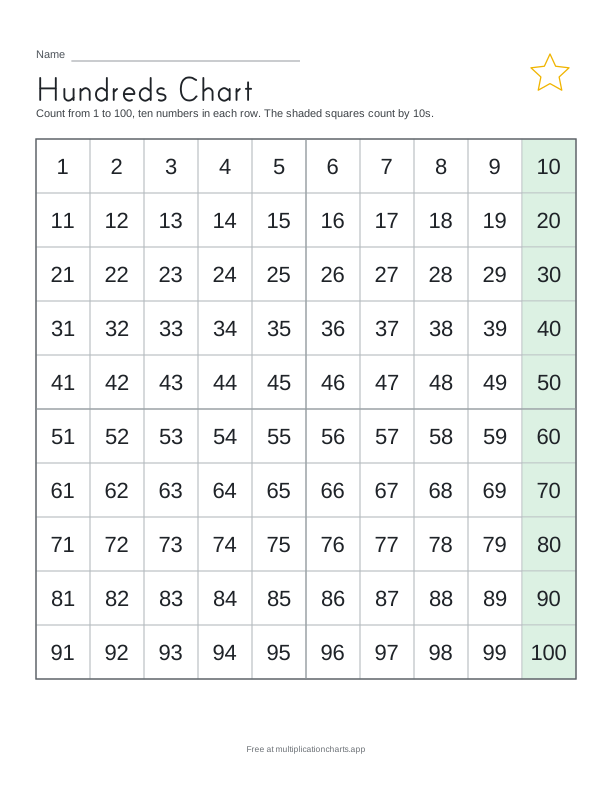
Count by tens
With 10s marked, the last column holds 10, 20, 30 and on to 100: 10 numbers, one at the end of each row.
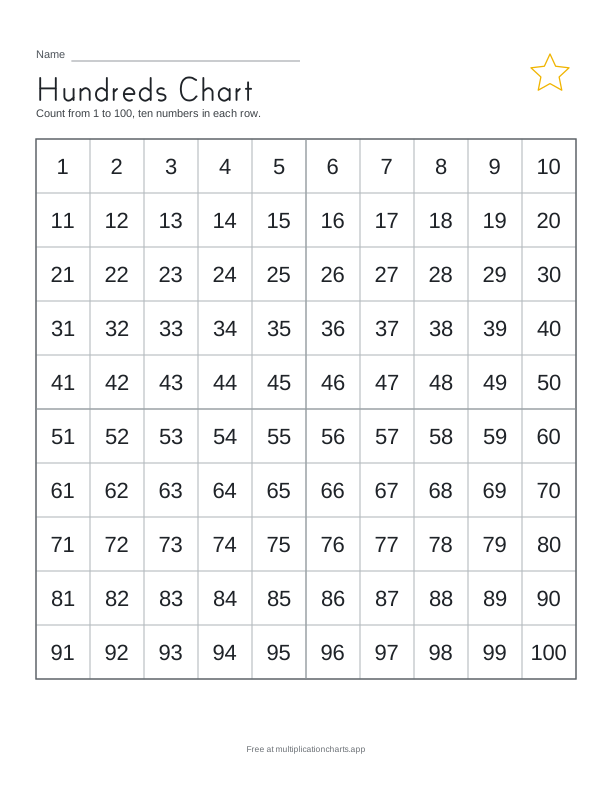
Count on from any number
Put a finger on 37 and count on five squares: 38, then on to 42. Each step to the right is one more.
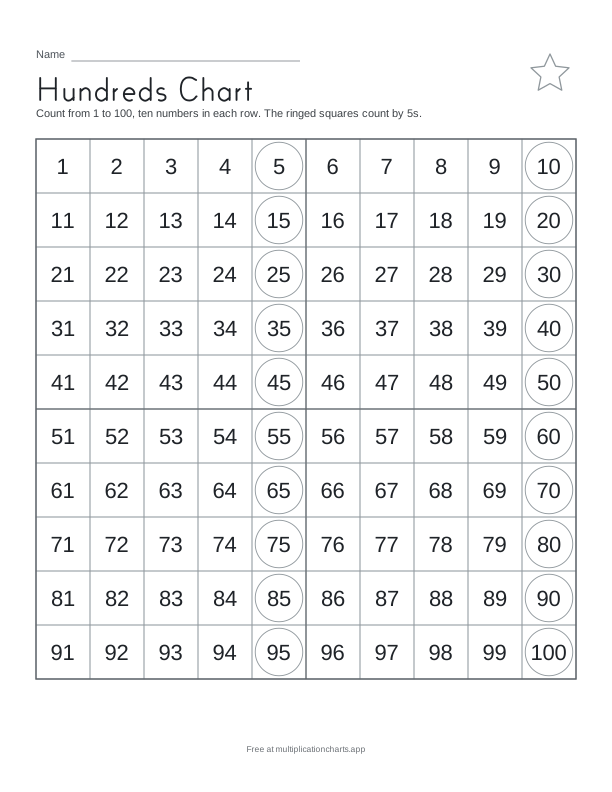
Ten more, ten less
One square down from 37 is 47, ten more. One square up is 27, ten less. The ones digit stays the same.
How to use it
- Choose the chart (1 to 100, 1 to 120 or 0 to 99), then filled in, blank or missing numbers.
- Type a name if you want one at the top. Leave the box empty for a plain chart.
- Press Preview to see the page, then Download PDF or Print. Print at 100% (actual size).
Ink saver leaves out the colored fills, for a black-and-white printer or to use less ink.
Charts to print
Times tables
One sheet for each table from 2 to 12: the facts, then a practice column.
Questions and answers
What is a hundreds chart?
A hundreds chart is a grid of the numbers 1 to 100, ten to a row, so each row starts one ten higher than the row above. It is also called a 100 chart or a hundred chart.
Is this the same as a multiplication chart 1 to 100?
No. This chart counts from 1 to 100. A multiplication chart shows products: the 1–100 multiplication chart on this site has every answer from 1 × 1 to 100 × 100.
Should the chart start at 0 or at 1?
Both are in use. The 1 to 100 chart ends each row on a ten (10, 20, 30). The 0 to 99 chart starts each row on a ten (0, 10, 20), so every number in a row shares its tens digit. Choose 0 to 99 under Chart.
What do the marked squares show?
Choose 2s, 5s or 10s under Mark skip counts. In color those squares are tinted; in ink saver each one gets a ring. Reading the marked squares in order counts by that number.
How do I print it at the right size?
Download the PDF and print at 100% (actual size). Every chart fits US Letter or A4 inside a half-inch margin.